
Shopping Cart
$30T
Equity wealth destroyed
across the last 5 stock crises
across the last 5 stock crises
229%
Buffett Indicator reading
in early 2026 — "strongly overvalued"
in early 2026 — "strongly overvalued"
+400%
Gold mining stocks gain
while equities fell –89% in 1929–1933
while equities fell –89% in 1929–1933
Introduction
$30 trillion in equity wealth has been wiped out across the last five stock crises since 1929 — yet each collapse also created the decade's most powerful wealth transfer toward those who were prepared. As of May 2026, the Buffett Indicator sits at 229% of GDP — a level exceeded only once in 150 years of market history. The yield curve has inverted. Margin debt is at historic extremes. And gold, already at $4,700/oz, continues its structural rally as institutional capital rotates toward safety.
At goldminer.fr, Arnaud and Olha have personally navigated three full stock crises since 2007 — 2008, 2011, and 2020 — building frameworks that outperformed broad equities in each cycle. This guide gives you the complete playbook: how to recognize a stock market crash before it peaks, how gold and silver have historically behaved during every major collapse, and the concrete steps to protect — and grow — your capital when others are losing theirs.
This article is for educational purposes only. Historical patterns and cycle theories
are analytical frameworks — not guarantees of future performance. Consult a qualified
financial advisor for personalized allocation decisions.
01
What Is a Stock Crisis? (And Why It's Different from a Correction)
Most investors use the terms correction, bear market, and stock crisis interchangeably — but the distinctions matter enormously for your response strategy. Misreading the depth of a decline is how investors lock in permanent losses buying what they believe is a "dip" in a structural collapse.
Stock crisis vs. correction vs. bear market — the technical thresholds
| Type of Decline | Peak-to-Trough Drop | Typical Duration | Average Recovery Time |
|---|---|---|---|
| Correction | –10% to –20% | 3–4 months | 4–6 months |
| Bear Market | –20% to –40% | 6–18 months | 1–3 years |
| Stock Crisis / Crash | –40% to –89% | 1–4 years | 3–25 years |
A genuine stock crisis — the equity market crash that reshapes economies — is characterized not just by depth, but by structural causes: credit contraction, systemic insolvency risk, or the bursting of a multi-year speculative bubble built on excess leverage. The collapse of stock market valuations in these events tends to overshoot rational fair value on the downside, just as they overshoot on the upside during the preceding euphoria.
The 4 stages of every stock crisis
Every major equity market crash since 1929 has followed the same psychological arc — what behavioral economists call the four-stage crisis cycle. Recognizing which stage you are in is the foundational skill of crisis investing.
-
Euphoria
Valuations detach from fundamentals. "This time is different" becomes the dominant narrative. The Buffett Indicator and CAPE ratio reach generational extremes. Retail participation surges. Margin debt peaks. Risk feels invisible — which is precisely when it is most acute.
-
Denial
The first significant decline is dismissed as a healthy correction. Institutional investors "buy the dip." Media reassures. Selling feels irrational. This stage often lasts months and produces sharp counter-rallies that trap late buyers at elevated prices.
-
Panic
Forced selling cascades as margin calls trigger across overleveraged portfolios. Liquidity evaporates. Circuit breakers activate. Credit markets seize. Correlations across asset classes collapse toward 1. Gold briefly dips with everything — then decouples sharply upward.
-
Capitulation
The final flush — emotionally exhausted investors sell at any price to "make the pain stop." Volume spikes on down days. This is the structural low — and the entry point that creates generational wealth for those who prepared in advance. This is when gold mining stocks historically deliver asymmetric returns.
⚡ The goldminer.fr Cycle Insight
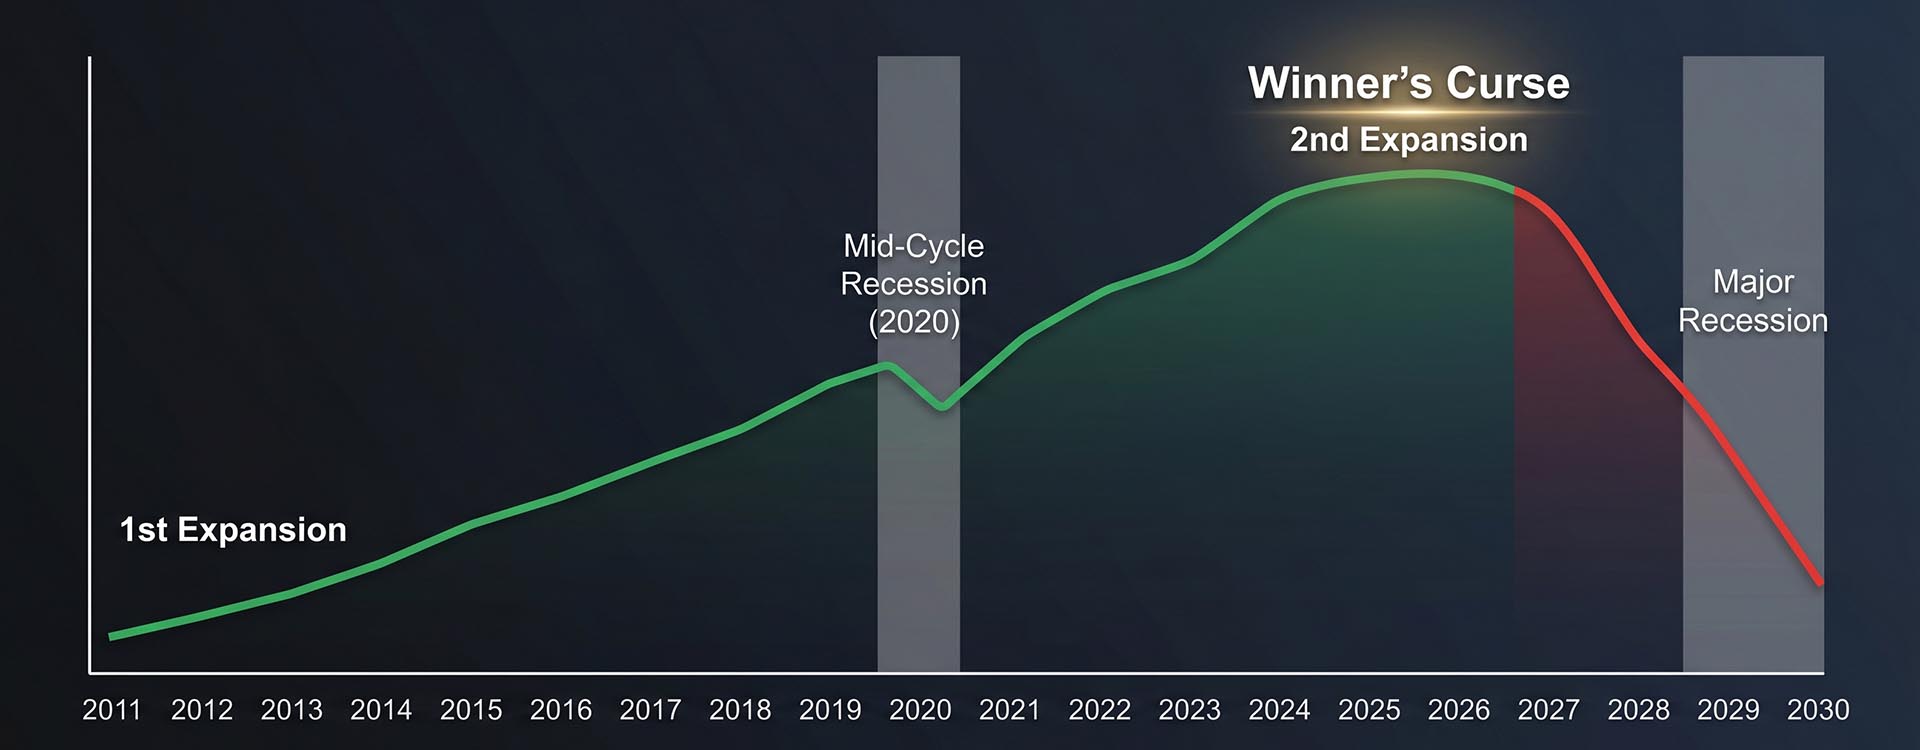
The 18.6-year real estate and economic cycle — first documented by economist Homer Hoyt — shows that major stock crises cluster around the cycle's Contraction phase: 2008 (perfectly on-cycle), and the window now opening in 2026–2030. This is not a prediction — it is a structural risk framework that demands preparation today. Explore the full 18-year cycle analysis →
02
The 7 Warning Signals Every Stock Crisis Reveals Beforehand
No stock crisis arrives without warning — in retrospect, every market crash stock event has been preceded by a recognizable constellation of signals. The 2000 dot-com collapse, the 2008 financial meltdown, even the 1929 crash: all were predicted by analysts who monitored the right indicators. Here are the seven signals that have the strongest empirical track record.

Signal 1 — Yield curve inversion
When short-term US Treasury yields exceed long-term yields, the yield curve inverts. This signal has preceded every US recession since 1955 with a 12–18 month lead time. It inverted before 2000, 2008, and 2020. It has been periodically inverted again throughout 2025–2026, signaling that the bond market — the largest and most sophisticated in the world — is pricing in significant economic deterioration ahead.
Signal 2 — Buffett Indicator and CAPE ratio at extreme levels
The Buffett Indicator — total US market capitalization divided by GDP — currently reads 229%, a level described by GuruFocus as "significantly overvalued" and surpassed only once in 150 years of market data. The Shiller CAPE ratio tells the same story: at current readings, forward 10-year real returns for equities are historically near zero or negative. These are not timing tools — they are structural risk gauges that tell you how much margin of safety remains. The answer in May 2026: very little.
Signals 3–7 — The full dashboard
| Signal | What It Measures | 2026 Status | Historically Predictive? |
|---|---|---|---|
| Yield Curve Inversion | Credit market stress | Active | 100% — every US recession 1955–2020 |
| Buffett Indicator (229%) | Market cap / GDP ratio | Extreme | Strong — peaked at 183% before 2000 crash |
| CAPE Ratio | Cyclically adj. P/E | Elevated | Strong — 10-yr forward returns near zero |
| Margin Debt Peak | Investor leverage level | Elevated | Peaked before 2000 and 2008 crashes |
| Credit Spread Widening | Corporate default risk | Rising | Leading indicator for equity stress |
| Insider Selling Surge | Corporate confidence | Elevated | Insiders sold heavily in 2007, 1999 |
| 18.6-Year Cycle Position | Land/credit cycle phase | Contraction Window | 2008 was the last major contraction |
"Six of seven pre-crisis signals are active simultaneously in 2026. The last time this convergence occurred was late 2007 — 14 months before the S&P 500 hit its crisis low."
03
How Gold and Silver Behave During Every Stock Crisis — 150-Year Data
The single most important empirical fact in crisis investing: gold has outperformed equities in 8 of the 9 years when the S&P 500 posted negative annual returns, averaging +19.4% versus –15.3% for stocks in those years. This is not coincidence — it is the structural function of precious metals as monetary insurance. Understanding how gold protects purchasing power during systemic stress is the foundation of crisis-resilient portfolio construction.
The historical record across 6 major crises
| Crisis | S&P 500 / DJIA Peak-to-Trough | Gold Performance | Gold Mining Stocks |
|---|---|---|---|
| 1929–1933 Great Depression | –89% | +69% (revalued 1934) | +400% (Homestake Mining) |
| 1973–1974 Oil Crisis | –48% | +168% | Strongly outperformed |
| 2000–2003 Dot-Com Crash | –49% | +12% to +60% | HUI index +600% |
| 2008 Financial Crisis | –56% | +5.5% (full year) | Mixed short-term, then +600% |
| 2011 Euro Debt Crisis | –19% | +10% peak | Lagged gold initially |
| 2020 COVID Crash | –34% | +25% | GDX +65% full year |
The 2008 case deserves nuance: gold initially fell –25% during the acute liquidity panic of July–September 2008 as forced sellers liquidated everything. But by year-end, gold finished +5.5% for the calendar year while the S&P 500 fell –33.36%. And from the 2008 low through 2011, gold rallied over 170%. The lesson: during the panic phase, gold may briefly correlate with stocks — but it decouples decisively once the monetary policy response begins. Investors who understand the difference between physical gold and mining stocks know exactly how to position for each crisis phase.
Gold during a stock crisis
- Structural safe-haven demand activates as fiat confidence erodes
- Central banks accelerate purchases (244t in Q1 2026 alone)
- Negative real yields — the strongest gold driver — intensify in a crisis
- Physical gold cannot go bankrupt, unlike equities or bank deposits
- Gold mining stocks offer 2–5× operating leverage on rising gold prices
Key risks to manage
- Acute liquidity panic may cause a brief –10%–25% gold dip (2008, March 2020)
- Mining stocks carry company-specific risk — not all miners survive a recession
- Junior explorers require precise timing — early cycle entry matters most
- Storage and insurance costs for physical gold must be factored into returns
- Currency-denominated gold prices can diverge from USD price
04
The goldminer.fr Crisis-Proof Portfolio Framework
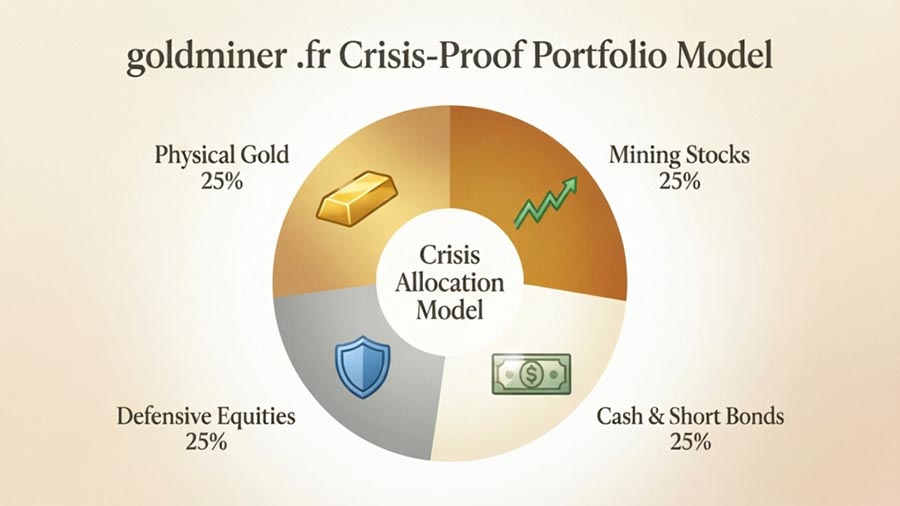
The 25/25/25/25 Allocation Model
Inspired by Harry Browne's Permanent Portfolio logic and refined through 19 years of real-world precious metals investing, the goldminer.fr crisis framework distributes capital across four quadrants designed to perform across all stock market cycle phases: physical gold as the monetary anchor (25%), gold and silver mining stocks as the growth amplifier (25%), cash and short-dated bonds as the optionality reserve (25%), and selective defensive equities — commodities, energy, utilities — as the inflation participation layer (25%).
This structure allows you to benefit from gold's safe-haven surge, mining stocks' leverage, and cash reserves to buy equity assets at capitulation prices — without being devastated by the collapse of a concentrated equity position. The goldminer.fr Elite Portfolio, actively managed and updated monthly, applies exactly this framework across approximately 30 carefully selected mining stocks with historically ~30% annual return.
When to rotate from equities to precious metals
The rotation signal is not an emotion — it is a checklist. When three or more of the following conditions align simultaneously, the framework calls for increasing precious metals allocation and reducing equity exposure: the Buffett Indicator above 200%, yield curve inverted for 6+ months, gold price making new all-time highs (confirming institutional flight to safety), central bank purchases exceeding 200 tonnes per quarter, and the 18.6-year cycle positioned in the Winner's Curse or Contraction phase. As of May 2026, all five conditions are met.
Mining stocks: asymmetric leverage during a stock crisis
If physical gold is your insurance policy, gold mining stocks are your call options on the gold price — with the critical advantage of not expiring worthless. When gold moves from $2,000 to $4,700 (as it has since 2022), a senior miner with $1,200 AISC sees its free cash flow explode from $800/oz to over $3,500/oz — a 338% improvement in profitability on a 135% gold price move. This operational leverage is the core thesis of investing in gold mining companies during a precious metals bull market. Junior exploration stocks, while highest risk, offer even more dramatic upside when entered at early cycle valuations.
05
5 Concrete Steps to Crisis-Proof Your Capital This Year

-
Audit your equity concentration now
Calculate what percentage of your portfolio would be lost in a –50% equity decline. If that number is uncomfortable, the time to act is before the panic phase — not during it. A beginner's guide to precious metals investing is the right starting point if you have not yet built a precious metals foundation.
-
Establish your physical gold anchor
Physical gold — coins or bars held outside the banking system — is the foundation that survives systemic failure. Aim for a minimum 10–15% allocation rising toward 20–25% as crisis signals intensify. Sovereign coins (Maple Leaf, Krugerrand, American Eagle) offer the best combination of liquidity, recognition, and lower premiums. Gold currently trades at ~$4,700/oz with J.P. Morgan forecasting $6,000 by end-2026.
-
Start a DCA program into gold and silver today
Dollar-cost averaging removes the impossible burden of calling the exact entry. A monthly DCA program across both physical gold and a diversified mining stock position smooths your average cost over the cycle while capturing structurally rising prices. This is the strategy endorsed by the best time to buy gold analysis — and by the World Gold Council's long-term wealth preservation research.
-
Build your mining stock watchlist — now, not at capitulation
The best mining stock entries happen in the pre-crisis window, when sector valuations are still reasonable relative to the gold price. Study senior miners (Newmont, Agnico Eagle, Barrick), mid-tiers, and selectively vetted junior explorers. Understanding what mining stocks are and how they work before prices gap up is the difference between strategic positioning and panic-chasing.
-
Download the full crisis allocation framework
The Golden Opportunities 300-page guide — written by Arnaud and Olha from 19 years of real-world experience since the 2007 financial crisis — covers every aspect of precious metals investing across economic cycles: physical gold storage, mining stock analysis, tax optimization, and the complete crisis portfolio allocation model. This is the playbook built through three live stock crises — not backtested theory.
06
Conclusion: A Stock Crisis Is Not the End — It's a Wealth Transfer
Every major stock crisis since 1929 has been, in retrospect, the largest wealth transfer of its decade — from the unprepared to the prepared. The $30 trillion lost in five crises was not destroyed: it moved. It moved toward those who held physical gold, who owned mining stocks before the rally, and who had the discipline to buy at capitulation when every headline screamed to sell.
6/7
Pre-crisis warning signals
active simultaneously in 2026
active simultaneously in 2026
8/9
Years of negative S&P returns
where gold outperformed
where gold outperformed
$6,000
J.P. Morgan gold price
target for end-2026
target for end-2026
Three things are now simultaneously true: the 18.6-year cycle is entering its Contraction phase, the most powerful valuation warning signals in a century and a half are flashing red, and gold — already +42% over the past year — is confirming that institutional capital has already begun its rotation. The question is no longer whether to act — it is how.
The Golden Opportunities guide — 300 pages of transparent, real-world expertise built through 19 years and three stock crises — gives you the complete framework. From first gold coin to crisis portfolio, it is the most comprehensive resource in the French-speaking precious metals world. Download the free chapter on crisis allocation today — and invest with clarity, not guesswork.
Past performance does not guarantee future results. Cycle frameworks are
educational tools, not predictive certainties. This article does not constitute
financial advice. Always consult a qualified advisor for decisions specific
to your situation.
07
Frequently Asked Questions (FAQ)
1
What exactly defines a stock crisis?
A stock crisis — also called an equity market crash or share market collapse — is defined as a sustained, structural decline of 40% or more in broad market indices, driven by systemic causes such as credit contraction, sovereign debt stress, or the bursting of a speculative asset bubble. It differs from a market correction (–10% to –20%) or a bear market (–20% to –40%) in both depth and duration, typically lasting 1–4 years and requiring 3–25 years for full real-terms equity recovery. The Great Depression (–89%), the dot-com collapse (–49%), and the 2008 financial crisis (–56%) are the canonical examples.
2
How often does a stock crisis happen historically?
Major stock crises have occurred approximately every 18–20 years over the past century, broadly aligning with the 18.6-year real estate and credit cycle first documented by economist Homer Hoyt. The 1929 crash, the 1973–74 oil crisis, the 1987 shock, the 2000–2003 collapse, and the 2008 financial meltdown all cluster around this rhythm. Milder bear markets occur more frequently — roughly every 7–10 years — but the systemic crises that reshape economies and create generational entry opportunities follow the longer cycle. The current cycle positions 2026–2030 as the next major contraction window.
3
Does gold always rise during a stock crisis?
Not immediately — and this distinction is critical. During the acute panic phase of a crisis, forced selling can briefly pull gold down alongside equities as leveraged investors liquidate everything for cash. In 2008, gold fell –25% between July and September before recovering. However, in 8 of 9 years when the S&P 500 posted negative annual returns, gold outperformed stocks on a full-year basis, averaging +19.4% versus –15.3%. Gold's outperformance becomes most pronounced in the 12–36 months after the initial panic — precisely as monetary policy responses (rate cuts, QE, debt monetization) erode the real value of cash and bonds.
4
Should I sell my stocks before a stock crisis?
This is a portfolio construction question, not a market timing question. Rather than attempting to sell everything at the precise top — which has failed even for the most sophisticated institutional investors — the evidence-based approach is to gradually reduce equity concentration as valuation signals reach extreme levels, and rotate that capital toward precious metals, cash, and defensive assets. The goldminer.fr 25/25/25/25 framework is designed to maintain performance across all cycle phases without requiring perfect timing. Consult a qualified financial advisor to adapt this framework to your specific tax situation and investment horizon.
5
How long does the average stock crisis last?
The peak-to-trough phase of a major stock crisis typically lasts 1–4 years. The 1929–1933 Great Depression took 4 years to reach its bottom. The 2000–2003 dot-com collapse lasted 3 years. The 2008 financial crisis bottomed in approximately 17 months from peak to trough. However, the recovery phase is dramatically longer in real (inflation-adjusted) terms: US equity investors who bought at the 1929 peak did not recover their real wealth for over 25 years. This asymmetry is why holding physical gold — which has no recovery risk — alongside equities fundamentally changes the risk profile of a portfolio during extended crisis cycles.
6
Are mining stocks safer than equities during a crash?
Gold and silver mining stocks are not inherently safer than broad equities — they are differently positioned. In the initial panic phase, mining stocks often fall alongside the market. But in the 12–36 months that follow, as gold prices surge on monetary policy responses, senior miners with low AISC costs see explosive free cash flow growth — generating returns that are structurally uncorrelated from the declining equity market. In 2000–2003, the HUI gold mining index rose over 600% while the S&P 500 fell 49%. Junior explorers carry more risk but offer greater potential leverage when entered at early-cycle valuations. Our beginner's guide to mining stocks explains how to evaluate both categories.
7
What's the best way to start protecting my portfolio today?
The most effective first step is building a physical gold foundation — sovereign coins or small bars held outside the banking system — representing a minimum 10–15% of investable assets. Second, initiate a monthly DCA program into either gold ETFs, physical gold, or a combination. Third, study the goldminer.fr Elite Portfolio framework to understand how to layer gold mining stocks for asymmetric upside. Gold currently trades at ~$4,700/oz with structural tailwinds intact — every major bank from J.P. Morgan to UBS now targets $6,000+ for 2026. The structural entry window, informed by six active pre-crisis signals, remains open. Act with a plan, not with panic.