
Shopping Cart

4
Phases every stock market
cycle has repeated since 1854
cycle has repeated since 1854
+193%
Gold miners gain during
the 1973–74 bear market
the 1973–74 bear market
$5,055
J.P. Morgan gold target
Q4 2026 (avg. price/oz)
Q4 2026 (avg. price/oz)
Introduction
Most investors lose money not because they pick bad stocks — but because they own the right stocks at the wrong moment in the cycle. Every stock market cycle since 1854, when the NBER began tracking expansions and contractions, has followed the same four-phase structure: accumulation, markup, distribution, and markdown. Miss the phase, miss the opportunity — or worse, hold straight through the crash.
This guide is not another academic description of cycles. It tells you exactly which stocks to own in each phase — including where gold, silver, and mining stocks fit in the rotation playbook. After 19 years navigating precious metals cycles since the 2007 financial crisis, the team at goldminer.fr has built a real-world, cycle-adjusted portfolio framework with approximately 30% annual returns through disciplined sector rotation. Here is how it works.
This article is for educational purposes only. Historical cycle patterns are
probabilistic frameworks, not guarantees of future performance. Always consult
a qualified financial advisor before making investment decisions.
01
Stock market cycles vs. economic cycles vs. business cycles — clearing the confusion
Investors use these three terms interchangeably — and that is where costly mistakes begin. Understanding how they differ, and how they interact, is foundational to any serious investment strategy.
The economic cycle
The economic cycle tracks real GDP growth, employment, inflation, and consumer spending. It is the broadest measure — the macro terrain on which everything else plays out. Expansions average roughly 58 months; contractions average around 11 months, according to NBER historical data. This is the slowest-moving cycle — a lagging indicator that confirms what markets already priced in months ago.
The business cycle
The business cycle measures corporate earnings momentum, capital expenditure, and inventory dynamics. It runs slightly faster than the economic cycle but still lags the stock market. When business investment peaks — as it did in tech infrastructure in 2000 and residential real estate in 2006 — the eventual correction tends to be severe. Crucially, commodity and mining capital expenditure cycles run counter to the broader business cycle, creating the structural supply deficits that ignite precious metals bull markets.
The stock market cycle — the one that pays
The stock market cycle is the only one that matters for portfolio timing. It leads the economic cycle by 6 to 9 months. Markets price in tomorrow's reality today. This is why buying when the economy looks terrifying (2009, 2020) consistently produces the best returns — and why holding equities at peak economic confidence (2007, 2021) routinely ends in pain.
| Cycle Type | What It Measures | Lead / Lag | Investor Relevance |
|---|---|---|---|
| Stock Market Cycle | Equity price trends, sentiment, liquidity | Leads by 6–9 months | Primary timing signal |
| Business Cycle | Earnings, capex, inventories | Coincident | Sector rotation signal |
| Economic Cycle | GDP, employment, inflation | Lags by 6–12 months | Confirmation only |
02
The 4 phases of every stock market cycle
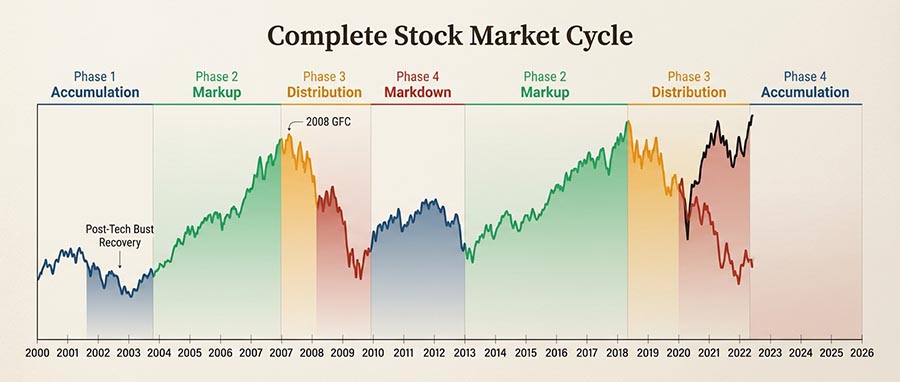
Every bull and bear market in recorded history has moved through the same four phases. The duration varies. The sequence does not.
Phase 1 — Accumulation (the bottom)
After the panic of a market crash subsides, sentiment sits at extreme lows. Valuations are compressed. Retail investors have capitulated and sworn off equities. This is precisely when institutional "smart money" quietly accumulates positions. Volume is low, volatility slowly declines, and the market trades sideways with occasional false breakdowns. The 2002 and 2009 bottoms are textbook examples — both felt dangerous to buy, yet both were the entry points that defined a decade of returns.
Phase 2 — Markup (the bull market)
Prices break higher with conviction. Early adopters profit; retail investors gradually return as the recovery becomes impossible to deny. Earnings expand, breadth is broad, and almost every sector participates. The 2009–2021 bull run — the longest in S&P 500 history — was a textbook extended markup phase. This is the phase where passive index investors thrive.
Phase 3 — Distribution (the top)
Smart money quietly sells into euphoria. Leadership narrows — breadth deteriorates even as headline indices hold near highs. Volume patterns shift. Insider selling accelerates. Retail participation peaks. This phase can last months, creating the dangerous illusion that the bull market is intact. Distribution is where most wealth destruction is set in motion — not during the markdown itself, when it is already too late.
Phase 4 — Markdown (the bear market)
Prices fall, sometimes violently. Panic peaks late in the phase. Liquidity dries up. The assets that worked best in the markup phase (high-multiple growth, speculative tech) suffer most. Meanwhile, counter-cyclical assets — physical gold, short-duration bonds, defensive mining stocks — begin their relative outperformance. The markdown phase resets valuations for the next accumulation.
⚡ The cycle insight that changes everything
The stock market cycle is not a prediction tool — it is a probabilistic positioning framework. You do not need to call the exact top or bottom. You need to recognize which phase is most likely active and rotate your portfolio accordingly. That discipline — applied consistently across three full bear markets since 2007 — is what powers the goldminer.fr approach.
03
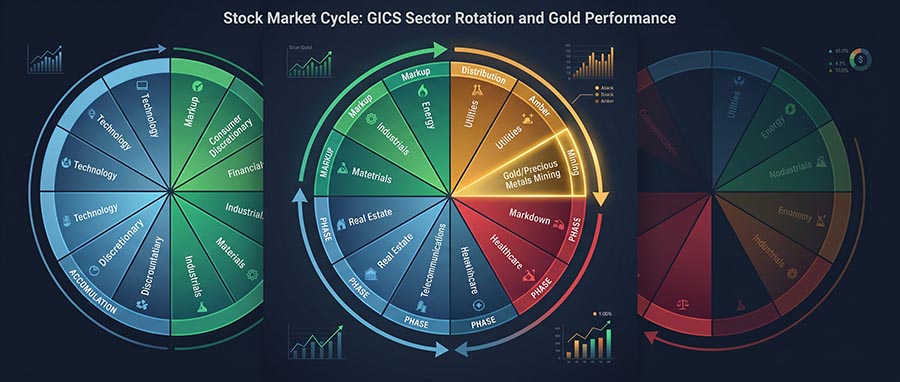
The sector rotation playbook — which stocks to own in each phase
Accumulation phase — beaten-down cyclicals and early gold reduction
At market troughs, the best opportunities lie in deeply oversold cyclical industrials (Caterpillar, Deere), financials with clean balance sheets, and small-caps priced for catastrophe. Gold is typically a relative underperformer here as risk appetite returns — this is the time to consolidate precious metals gains, not add aggressively. Junior gold stocks on the TSX can be an exception if they have been overlooked in the panic.
Markup phase — growth, technology, and consumer discretionary
The early and mid-markup rewards consumer discretionary, technology growth leaders, and transportation. Breadth is wide and sentiment is supportive. As the markup matures, energy and basic materials leadership emerges as commodity demand rises with the economic expansion. This is also when gold accumulation should begin gradually — not aggressively, but as a disciplined position-building exercise before inflation signals intensify.
Distribution phase — the critical pivot (where 2026 stands)
Defensive sectors — utilities, healthcare, consumer staples — take leadership. High-multiple technology and speculative growth face compression. This is precisely where gold and silver deserve aggressive allocation increases. The macro conditions supporting gold in 2025–2026 are structurally intact: 863 tonnes of net central bank purchases in 2025 (World Gold Council), persistent inflationary pressure, and accelerating de-dollarization among emerging market central banks. Senior miners (Newmont, Barrick, Agnico Eagle) offer earnings leverage; royalty companies (Franco-Nevada, Royal Gold) provide downside protection.
Markdown phase — gold, silver, and asymmetric mining bets
Physical gold and silver are the markdown phase's most powerful wealth preservers. Historical data is unambiguous: during the stagflationary bear market of 1973–74, the S&P 500 fell 48% while gold mining indices rose 193%. During the 2000–2002 tech bust, a new secular bull market for mining stocks launched precisely as Nasdaq peaked. Mining stocks become asymmetric bets at panic lows — particularly junior explorers trading below intrinsic value.
| Cycle Phase | Lead Sectors / Assets | Gold & Mining Role | Risk Level |
|---|---|---|---|
| Accumulation | Cyclical industrials, beaten-down financials, small-caps | Reduce / Consolidate | High volatility, high reward |
| Early Markup | Consumer discretionary, tech growth, transports | Begin gradual DCA | Moderate — broad opportunity |
| Late Markup | Energy, basic materials, industrial cyclicals | Build position actively | Rising — inflation emerging |
| Distribution | Utilities, healthcare, consumer staples | Aggressive allocation ↑ | High — senior + royalty focus |
| Markdown | Physical gold & silver, short-duration bonds, cash | Core holding + miner bets | Asymmetric — juniors at lows |
04
Why gold and mining stocks are the stock market cycle's best-kept secret
Gold does not merely "hold value" during downturns. When the conditions are right, it outperforms spectacularly — and mining stocks amplify that outperformance by a factor of 3 to 5 times. This is not speculation. It is 90 years of documented cycle behavior.
Consider the data. During the 1973–74 bear market, the S&P 500 fell 48%. The Barron's Gold Mining Index rose 193%. Over the full 11-year secular gold bull from 1969 to 1980, miners gained 1,247% while the S&P 500 returned just 43%. During the 2000–2002 tech bust, a new secular bull market for gold mining stocks began the very day Nasdaq peaked. The pattern is not coincidental — it is structural.
"Gold mining stocks run counter to the broad stock market cycle with a consistency that goes back to the Great Depression. Homestake Mining gained 49% while the Dow Jones fell 89% between 1929 and 1932. By 1936, it was up 580%. The countercyclical power of gold miners is the best-documented secret in investing." — Crescat Capital, Research Letter
The key structural driver: gold operates on a separate cycle from equities. When capital leaves overvalued growth stocks, it needs somewhere to go. In environments of currency devaluation, negative real interest rates, and geopolitical stress — all present today — that capital flows into gold and precious metals. Understanding the difference between physical gold and gold mining stocks is essential to capturing both the preservation and the amplification that this cycle offers.
J.P. Morgan's Global Research team projects gold prices averaging $5,055/oz by Q4 2026, with a longer-term scenario of $6,000/oz if just 0.5% of foreign US asset holdings rotate into gold — a scenario they describe as potentially arriving much quicker than expected, given mine supply inelasticity.
05
Common mistakes — and the cycle-adjusted portfolio framework that avoids them
Most retail investors systematically make the same errors across every cycle. They anchor to recent winners at the cycle top, sell defensive assets too early in the markup, and underweight gold during the distribution and markdown phases — precisely when it delivers its most powerful returns.
What works across cycles
- Building gold allocation early in the distribution phase, before headlines confirm the trend
- Using dollar-cost averaging into precious metals regardless of short-term noise
- Holding physical gold as the portfolio anchor through full cycle volatility
- Adding mining stocks as amplifiers when sector sentiment is at lows
- Rotating out of high-multiple growth before peak valuations become obvious
What consistently fails
- Anchoring to recent tech or growth winners at the distribution phase top
- Selling gold and defensive assets too early when markup phase returns feel irresistible
- Confusing a 10–15% cyclical correction for a full phase change
- Refusing to add gold because the price "already looks high"
- Reacting to headline fear or greed instead of cycle phase signals
The goldminer.fr dynamic allocation model
At goldminer.fr, Arnaud and Olha's cycle-adjusted framework adjusts gold weighting dynamically from approximately 5% at the accumulation phase bottom to 25–30% during the distribution and markdown phases. This is not a fixed allocation — it is a live rotation model reviewed monthly, informed by eight key cycle indicators: yield curve shape, advance/decline breadth, insider buying ratios, NYSE margin debt, VIX volatility regime, high-yield credit spreads, AAII sentiment surveys, and Federal Reserve policy stance.
For investors who want to understand how gold protects against inflation across full economic cycles, the structural case in 2026 is as clear as it has been since 2007: negative real yields, record central bank buying, dollar uncertainty, and equity valuations above their 1929 and 2000 bubble peaks on adjusted earnings measures. That combination of conditions has historically preceded some of gold's most extraordinary runs.

06
Conclusion: the cycle doesn't lie — position accordingly
Stock market cycles are not crystal balls. They are probabilistic frameworks built from 170 years of market history — and they reward the investors disciplined enough to act on signals rather than sentiment. The three principles that cut through the noise: the stock market leads the economy by 6–9 months, so act on cycle signals, not economic confirmation; gold and mining stocks are structurally counter-cyclical, making them indispensable during the distribution and markdown phases; and the biggest portfolio gains come from the most uncomfortable moments — accumulation bottoms and gold entry points that feel too risky to most investors.
+1,247%
Gold mining index return
1969–1980 bull cycle
1969–1980 bull cycle
863t
Central bank gold purchases
in 2025 — structurally bullish
in 2025 — structurally bullish
19 yrs
goldminer.fr cycle navigation
since the 2007 crisis
since the 2007 crisis
The current distribution phase environment — with equity valuations above historical bubble peaks, gold at structurally elevated demand levels, and J.P. Morgan projecting $5,055/oz by Q4 2026 — is precisely the cycle moment where precious metals positioning matters most. The Golden Opportunities guide — 300 pages written by Arnaud and Olha, drawing on 19 years of navigating precious metals across three full bear markets — gives you the complete cycle-based framework for building and managing a gold and mining stock portfolio with clarity, not guesswork.
Historical cycle patterns are educational frameworks, not guarantees of future
performance. Past returns of gold mining indices do not predict future results.
This article does not constitute personalized financial advice. Please consult a
qualified advisor for decisions tailored to your situation.
07
Frequently asked questions (FAQ)
1
What are the 4 phases of a stock market cycle?
The four phases of every stock market cycle are: Accumulation (smart money buys quietly after capitulation, sentiment at extreme lows); Markup (prices rise broadly, retail investors return, earnings expand); Distribution (smart money sells into euphoria, breadth narrows, divergences emerge); and Markdown (prices fall, panic peaks, the cycle resets). Every stock market since 1854, tracked by the NBER, has followed this four-phase structure — the duration varies, the sequence does not.
2
How long does a complete stock market cycle last on average?
A complete stock market cycle — from one bear market trough to the next — has historically averaged 4 to 6 years, though the range is wide. The shortest post-war cycle ran roughly 2.5 years (2020 crash to recovery); the longest was the 2009–2020 bull market lasting over 11 years. Bull phases (markup) average 58 months according to NBER data; bear phases (markdown) average around 11 months but can cause disproportionate damage to undiversified portfolios.
3
What is the difference between the stock market cycle and the business cycle?
The stock market cycle leads the business cycle by 6 to 9 months. The business cycle measures corporate earnings, capital expenditure, and inventory dynamics — it is a coincident or slightly lagging indicator. The economic cycle (GDP, employment, inflation) lags even further, by 6 to 12 months. This is why markets often bottom during recessions and peak during strong economic growth — they are pricing in tomorrow's reality today. Acting on cycle signals rather than economic confirmation is the discipline that separates informed investors from reactive ones.
4
Which stocks perform best at the bottom of the stock market cycle?
At the accumulation phase bottom, the best-performing stocks are typically deeply oversold cyclical industrials (Caterpillar, Deere), financials with clean balance sheets, and small-cap value stocks priced for catastrophe. Junior gold mining stocks listed on the TSX Venture can also offer extraordinary asymmetric opportunities when they have been indiscriminately sold during panic. For a beginner's guide to mining stocks, goldminer.fr provides accessible, real-world sector analysis.
5
When should I buy gold during a stock market cycle?
Gold should be accumulated gradually throughout the late-markup phase as inflation indicators rise, then increased more aggressively during the distribution and markdown phases. The structural conditions for gold in 2025–2026 — 863 tonnes of central bank purchases, negative real yields, dollar uncertainty — are classic late-cycle and distribution-phase triggers. Dollar-cost averaging into physical gold and senior miners removes the burden of exact timing. Learn more about when to buy gold with goldminer.fr's dedicated timing guide.
6
How do mining stocks behave across stock market cycles?
Gold mining stocks are structurally counter-cyclical to the broad equity market — one of the most documented patterns in financial history. During the 1973–74 bear market, gold mining indices rose 193% while the S&P 500 fell 48%. In the 1969–1980 secular gold bull, the Barron's Gold Mining Index gained 1,247% versus 43% for the S&P 500. Mining stocks offer 3–5× leverage to the gold price in bull phases but require more precise timing than physical gold. Senior miners offer stability; junior explorers offer asymmetric upside with binary risk.
7
Are we currently at the top of a stock market cycle in 2026?
Multiple indicators suggest the US equity market is in an advanced distribution phase in 2026: the Shiller CAPE ratio is above its 1929 peak on margin-adjusted measures; tech sector valuations exceed their 2000 bubble levels by EV-to-GDP measures; breadth is narrowing; and sector rotation into defensives, industrials, and gold is already underway. No cycle indicator guarantees a precise top — but the convergence of signals warrants increasing defensive and precious metals exposure. Consult a qualified financial advisor for personalized guidance tailored to your risk tolerance and objectives.