


Shopping Cart
200+
Years of accurate
cycle predictions
cycle predictions
18.6
Average years
between cycle peaks
between cycle peaks
2026
Projected cycle peak
— Winner's Curse phase
— Winner's Curse phase
Introduction
What if a single economic model had correctly forecast the 1929, 1973, 1990, and 2008 property crashes — for over 200 consecutive years? The 18.6-year real estate cycle is not a theory. It is one of the most rigorously documented macro patterns in economic history, first formalized by economist Homer Hoyt in his landmark 1933 doctoral dissertation on Chicago land values, and later refined for modern investors by Phil Anderson and Akhil Patel.
In May 2026, that model places us squarely in the most dangerous phase of the cycle — the "Winner's Curse" — a period of maximum overconfidence, speculative excess, and hidden fragility that historically precedes the sharpest contractions. At goldminer.fr, we have been tracking this cycle in real time since the 2007 peak, giving us a complete 19-year observed view of exactly one full cycle. This article delivers what most cycle commentators don't: not just theory, but concrete stock allocation guidance for each phase.
This article is for educational purposes only. Historical cycle patterns are frameworks,
not guarantees. Always consult a qualified financial advisor before making investment decisions.
01
What Is the 18.6-Year Real Estate Cycle — And Why It Works
Homer Hoyt's 1933 foundation
In 1933, economist Homer Hoyt published One Hundred Years of Land Values in Chicago, tracking every peak and trough in urban land prices back to 1830. His finding was striking: land value cycles repeated with uncanny regularity at intervals averaging 18.6 years. This was not a housing market pattern — it was a financial credit cycle, driven by the expansion and collapse of debt secured against land.
Phil Anderson, author of The Secret Life of Real Estate and Banking, extended Hoyt's research through 225 years of American land data. Akhil Patel further refined the cycle's phase timing for contemporary investors. All three researchers reach the same conclusion: the cycle's engine is credit — banks lend against land, prices rise, speculation accelerates, debt becomes unsustainable, and the system resets.
Why exactly 18.6 years?
The 18.6-year figure is a statistical average across cycles ranging from 17 to 21 years. The duration is determined by the credit accumulation cycle: it takes approximately 14 years of rising asset prices to generate enough leverage and speculative overextension to trigger a systemic reset, followed by 4 years of painful deleveraging. The cycle is not mechanical — it is psychological and financial, which is why it persists despite widespread awareness of it.
The predictive track record
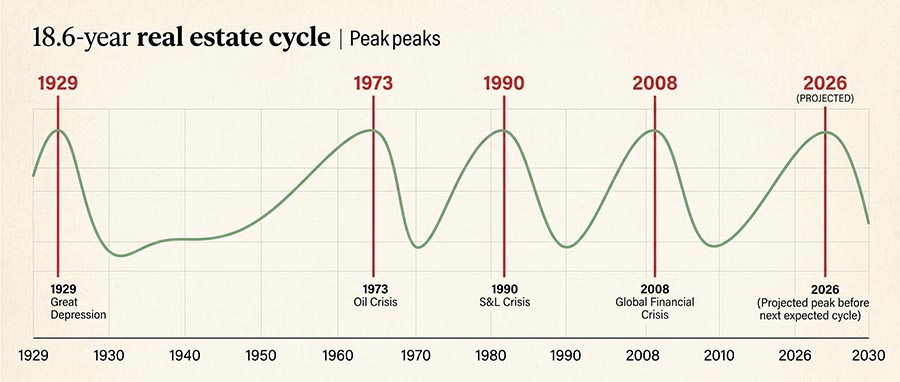
The cycle has forecast every major property-led financial crisis in modern history: 1818, 1836, 1854, 1873, 1893, 1907, 1929, 1973, 1990, and 2008. As economist Michael Hudson noted in a 2026 interview: "It may very well be a crash in 2026. That makes sense to me. All of the signs say that there's going to be a crash — right on schedule." When a heterodox economist of Hudson's stature agrees with cycle analysts, institutional investors pay attention. Individual investors should too.
📐 The Cycle Structure at a Glance
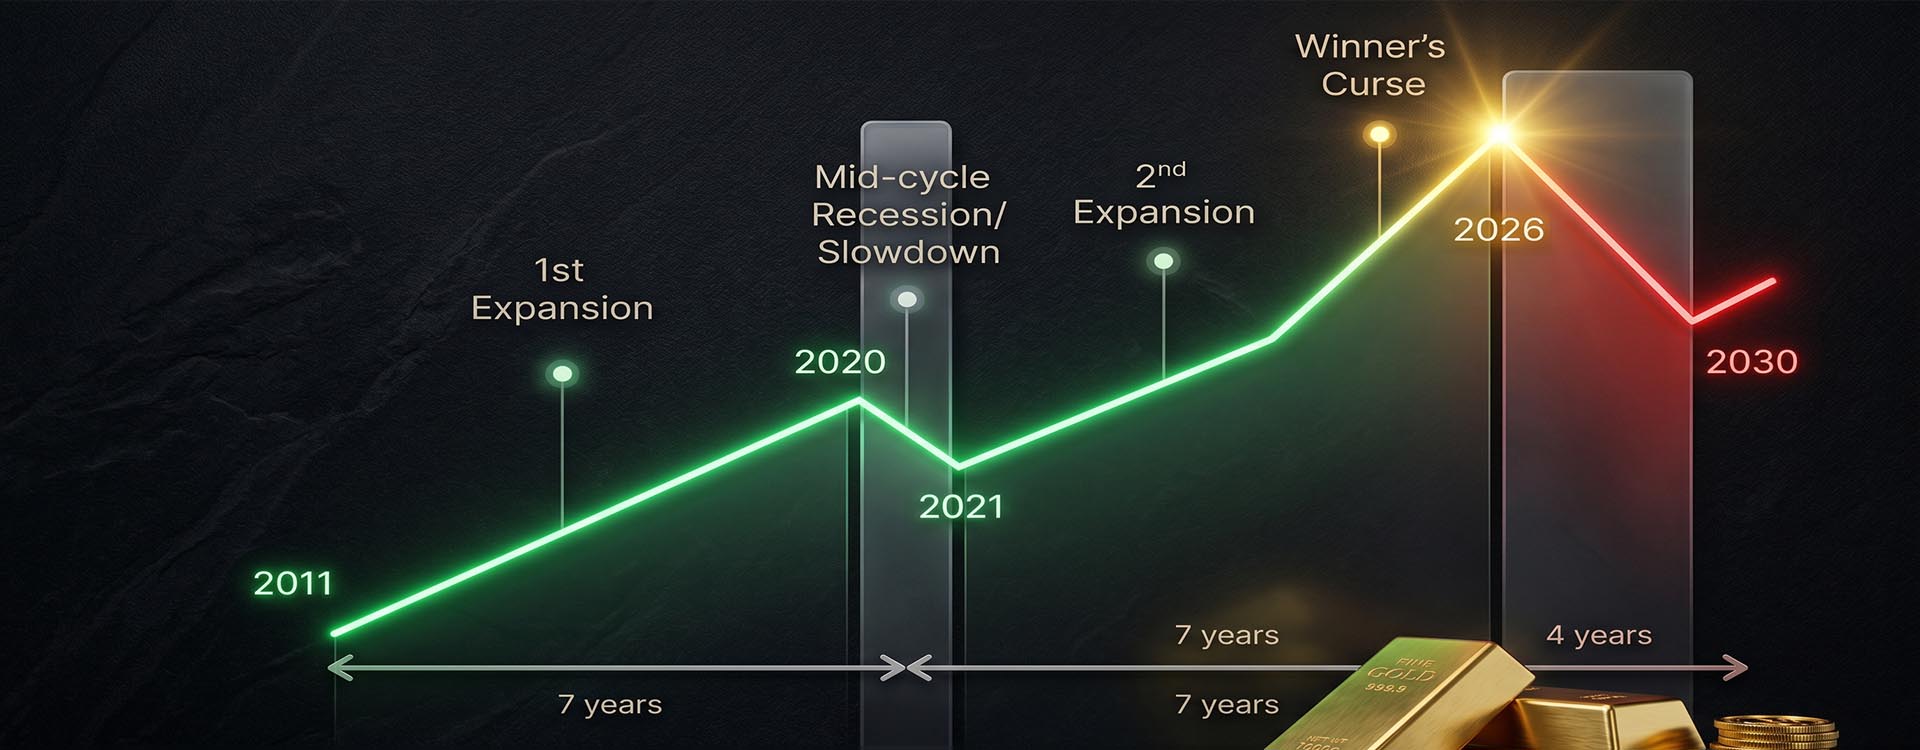
14 years up (7-year 1st Expansion + mid-cycle pause + 7-year 2nd Expansion including Winner's Curse) → 4 years down (Major Recession / Contraction). The cycle measured from peak to peak, not trough to trough.
02
The 4 Phases of the 18.6-Year Cycle — And the Investor Mindset for Each
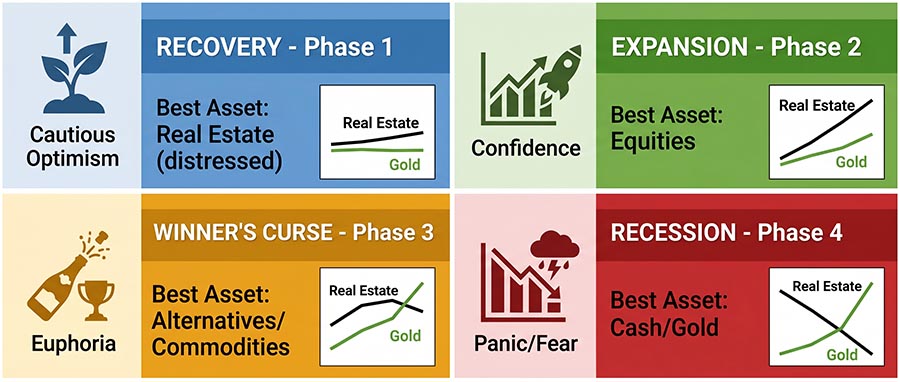
| Phase | Duration | Sentiment | Credit Conditions | Best Asset Class |
|---|---|---|---|---|
| Recovery | ~4 years | Fear / Denial | Tight, defaults flushed | Distressed equities |
| 1st Expansion | ~7 years | Cautious optimism | Loosening steadily | REITs, builders, industrials |
| 2nd Expansion / Winner's Curse | ~5–7 years | Overconfidence / Greed | Overextended, speculative | Gold, miners, defensive stocks |
| Contraction | ~4 years | Panic / Capitulation | Frozen, cascading defaults | Physical gold, cash, senior miners |
Phase 1 — Recovery (Years 1–4 post-crash)
The aftermath of collapse is defined by depressed sentiment, low transaction volume, and forced deleveraging. Credit is rationed. Unemployment peaks. This is the phase where the historically informed investor begins accumulating distressed quality assets — not at the first sign of recovery, but systematically, as balance sheets are cleaned and valuations touch genuine trough levels.
Phase 2 — Expansion and Mid-Cycle Slowdown (Years 5–11)
Confidence returns incrementally. Real estate and equities rise steadily. A mid-cycle pause — typically lasting 12–18 months and alarming enough to generate recession fears — separates the 1st and 2nd expansion legs. The 2020 COVID shock was precisely this mid-cycle slowdown in the current cycle. Most investors exited the market in fear, missing the entire second expansion.
Phase 3 — Winner's Curse (Years 12–18)
This is where we are in May 2026. Speculation runs rampant. Everyone feels like a genius. Leverage reaches unsustainable extremes. According to Akhil Patel, the property market should peak in 2026 with a major financial crisis 6–12 months later. The Winner's Curse phase is named for a cruel irony: those who enter last win the auction and inherit all the risk.
Phase 4 — Contraction (Years 18–22)
Liquidity evaporates. Defaults cascade. Banks restrict lending. Land prices collapse 30–60% from peak. Equity markets typically fall 40–60%. Cash and hard assets — gold, silver, physical precious metals — become the most valuable items in any portfolio. This is not catastrophism; it is the documented behavior of every cycle since 1818.
03
Where We Are in 2026 — The Evidence Is Unambiguous
Map the current cycle from its 2008–2009 trough. Seven years of 1st expansion (2009–2016). The mid-cycle slowdown in 2020, exactly on schedule. Seven years of 2nd expansion (2021–2026), now entering its terminal Winner's Curse phase. The structural data confirms the clock: home affordability is at historic lows, commercial real estate stress is escalating, and speculative activity has returned with full force to equity and property markets alike.
⚠ 7 Late-Cycle Warning Signals — Active in 2026
(1) Home price-to-income ratios at generational extremes. (2) Commercial real estate vacancy rates surging. (3) Regional bank exposure to CRE loans exceeding stress limits. (4) Corporate debt at record levels relative to GDP. (5) US fiscal deficit accelerating with no structural correction in sight. (6) Speculative IPO and M&A activity rebounding. (7) Retail investor sentiment approaching euphoric readings. This is the late-cycle fingerprint — and it matches every prior peak.
"The cycle has always worked in the past because human psychology — greed, fear, overconfidence — does not change. The debt machine operates the same way in 1926 as in 2026. The names change; the script doesn't." — Phil Anderson, The Secret Life of Real Estate and Banking
04
Which Stocks to Favor in Each Phase of the 18.6-Year Cycle
Recovery Phase — Distressed Value (Post-2008 playbook)
After the collapse flushes excess leverage, the best opportunities emerge in distressed homebuilders (DR Horton, Lennar at trough valuations), mortgage REITs with cleaned balance sheets, and regional banks trading below book value. Understanding how mining stocks respond to cycle resets is equally important here — gold miners often begin their strongest multi-year runs from these exact recovery entry points.
Expansion Phase — Growth and Infrastructure
As credit loosens and real estate activity normalizes, building materials companies (Vulcan Materials, Martin Marietta), industrial REITs like Prologis, and residential REITs benefit most. Mid-cycle, rotate toward home improvement (Home Depot, Lowe's) and infrastructure plays that benefit from rising construction activity. This is also the moment to begin quietly building the precious metals foundation that will protect wealth through the eventual turn.
Winner's Curse Phase — The Current Moment (2024–2026)
Some late-cycle plays still work — luxury homebuilders like Toll Brothers, for instance — but the primary strategic move is building gold and silver positions. This is the core thesis at goldminer.fr, informed by 19 years of observation since the 2007 peak. Senior miners like Newmont and Agnico Eagle offer operational leverage to a gold price that reached $5,608/oz in January 2026. Royalty companies — Franco-Nevada, Wheaton Precious Metals — provide asymmetric upside with lower operational risk, making them ideal for investors navigating the physical gold versus mining stocks decision.
Contraction Phase — The Defensive Playbook (2026–2030)
Physical gold and silver become the primary capital preservation tools. Senior gold miners with strong balance sheets — those with low all-in sustaining costs (AISC) and minimal debt — continue to appreciate as gold rises during deleveraging. Avoid: REITs, regional banks with CRE exposure, and leveraged property developers. Maintain significant cash reserves to exploit the extraordinary buying opportunities that emerge mid-contraction.
| Cycle Phase | Property / REITs | Equities | Gold / Miners | Cash |
|---|---|---|---|---|
| Recovery | Selective — distressed | Overweight builders, banks | Accumulate quietly | 10–15% |
| 1st Expansion | Overweight — REITs | Overweight growth | Hold / slowly build | 5–10% |
| Winner's Curse | Reduce exposure | Selective, defensive | Overweight — core thesis | 15–20% |
| Contraction | Avoid | Minimal — seniors only | Maximum weight | 20–30% |
05
The Gold–Real Estate Inverse Correlation No One Talks About
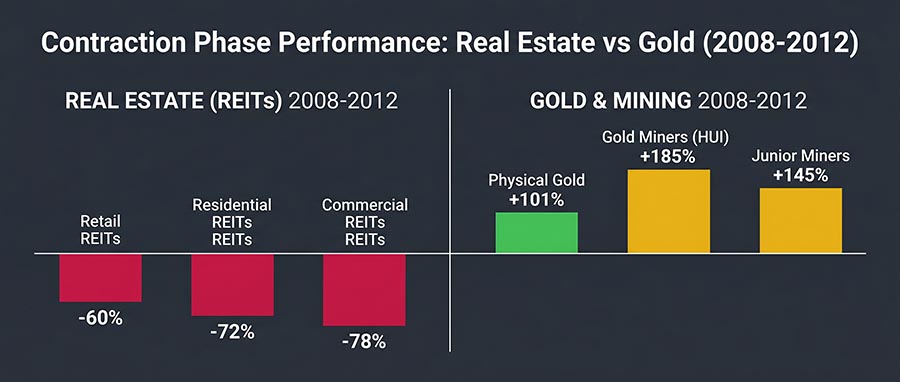
During every documented contraction phase, gold has outperformed real estate — often dramatically. The 2008–2011 case is the clearest modern example. REITs collapsed 60–78% from their 2007 peaks. According to the US Bureau of Labor Statistics, gold surged over 101% from 2008 to 2012. The HUI Gold Miners Index — which tracks senior gold mining stocks — rallied approximately 185% from its 2008 lows to its 2011 peak.
The mechanism is straightforward: when credit collapses and paper assets lose value, investors and central banks rush to the one asset that has no counterparty risk. Understanding how gold protects against inflation and systemic crises is therefore inseparable from understanding cycle positioning. Gold does not merely survive contractions — it thrives in them, precisely because it is the antithesis of leveraged credit.
The quantara.com.au analysis of the 18.6-year cycle confirms this pattern: "Precious metals steadily increase in both Phase 2 and Phase 3 — gaining value through both the euphoria and the crash." This dual-phase outperformance is the most compelling structural argument for holding gold through the late-cycle environment of 2026.
What works in late-cycle 2026
- Building a core physical gold allocation (10–20% of portfolio)
- Adding senior gold miners with low AISC and strong cash flow
- Royalty companies (Franco-Nevada, Wheaton) for asymmetric leverage
- Maintaining 15–20% cash for contraction opportunities
- Reducing leveraged real estate and rate-sensitive equity exposure
What fails at the cycle peak
- Chasing real estate at peak affordability multiples
- Overweighting REITs with high floating-rate debt exposure
- Holding regional banks with commercial real estate concentration
- Ignoring cycle signals in favor of short-term momentum
- Waiting for "confirmation" of the crash before repositioning
06
The 2026–2030 Action Plan: 5 Steps to Navigate the Cycle Turn
-
Reduce real estate and rate-sensitive equity exposure now
Late-cycle is not the time to add leveraged property positions. Trim overweight REIT allocations and regional bank holdings. The reward-to-risk ratio has inverted.
-
Build a core physical gold position (10–20% of portfolio)
Physical gold is the anchor. Coins, bars, allocated accounts — assets with no counterparty risk. Explore the full framework in our Golden Opportunities guide, 300 pages built on 19 years of real-world cycle experience.
-
Add mining stocks with strong cash flow at $4,000+ gold
Senior miners with low AISC generate exceptional free cash flow at current gold prices. Royalty and streaming companies (Franco-Nevada, Wheaton) offer the most attractive risk-adjusted exposure. The goldminer.fr Elite Portfolio provides monthly-tracked positions built precisely for this phase of the cycle.
-
Maintain 15–20% cash reserves for the contraction buying window
The contraction phase creates historic entry points in distressed equities, land, and beaten-down miners. Dry powder at cycle lows is worth more than any position held through the crash. Patience is the strategy.
-
Eliminate leverage and floating-rate debt from your personal balance sheet
The cycle does not destroy assets — it destroys leveraged owners of assets. Reducing personal debt exposure before the contraction is as important as any investment decision.
07
Conclusion: The 18.6-Year Real Estate Cycle Is a Framework, Not a Fear Story
The 18.6-year real estate cycle does not predict the future with certainty. It provides a probability-weighted framework refined by 200 years of consistent evidence. The investors who have used it as a positioning tool — rather than an excuse for inaction — have consistently outperformed through every cycle turn since 1929.
At goldminer.fr, Arnaud and Olha have been observing this cycle live since the 2007 peak — one complete 18.6-year arc. That experience is embedded into every recommendation in the free precious metals guide and the monthly-tracked Elite Portfolio. If the next contraction mirrors prior cycles, the window to reposition is measured in months, not years. The time to act is before the crash is confirmed — not after.
+185%
HUI Gold Miners rally
from 2008–2011 cycle lows
from 2008–2011 cycle lows
$6,000
J.P. Morgan gold target
for end-2026
for end-2026
19 yrs
goldminer.fr cycle
observation since 2007
observation since 2007
08
Frequently Asked Questions (FAQ)
1
What is the 18.6-year real estate cycle in simple terms?
The 18.6-year real estate cycle is a recurring economic pattern in which land values, credit conditions, and financial markets follow a broadly predictable arc of approximately 14 years of rising prices followed by 4 years of contraction. Averaged over 200 years of recorded data, the cycle peaks every 18.6 years. The engine is credit: banks lend against land, prices rise, speculation builds, debt becomes unsustainable, and the system resets — then begins again. It is not a housing market theory but a financial credit cycle.
2
Who created the 18.6-year real estate cycle theory?
The theory was first formalized by economist Homer Hoyt in his 1933 doctoral dissertation One Hundred Years of Land Values in Chicago. Phil Anderson extended this research through 225 years of American land data in his book The Secret Life of Real Estate and Banking. Akhil Patel further refined the phase timing for modern investors. All three researchers identify the same core mechanism: credit-driven land speculation collapsing under its own weight at regular intervals.
3
Did the 18.6-year cycle correctly predict the 2008 crash?
Yes. Measuring from the prior cycle peak in 1989–1990 (the S&L crisis and property crash), an 18.6-year forward projection lands precisely on 2007–2008 — when the US housing market collapsed and triggered the global financial crisis. Phil Anderson's work, widely circulated before 2007, identified this peak in advance. The 2020 COVID shock also aligned with the expected mid-cycle slowdown, further validating the model's predictive consistency.
4
When will the next real estate crash occur according to the cycle?
Measuring from the 2008–2009 trough, the cycle projects a peak between 2025 and 2028, with the central estimate around 2026. Akhil Patel predicts the property market will peak in 2026, with a major financial crisis following 6–12 months later in 2027. Economist Michael Hudson has described this timeline as "quite likely" and "right on schedule." The range is 2026–2028 given the cycle's historical variability of 17–21 years.
5
Which stocks perform best during the explosive Winner's Curse phase?
During the Winner's Curse phase, the best risk-adjusted performers are gold mining stocks and royalty companies — because they capture the late-cycle gold price surge while offering more defensibility than cyclical equities. Senior miners (Newmont, Agnico Eagle) provide operational leverage, while royalty and streaming companies (Franco-Nevada, Wheaton Precious Metals) offer asymmetric upside with lower balance sheet risk. Some late-cycle real estate plays (luxury homebuilders) still work, but the reward-to-risk ratio favors precious metals. Discover the best gold mining stocks to consider for this phase.
6
How does gold behave during the contraction phase of the real estate cycle?
Gold is the strongest performer during contraction phases. In 2008–2012, gold rose over 101% while REITs lost 60–78% of their value. The HUI Gold Miners Index gained approximately 185% from its 2008 lows. This pattern has repeated in every documented contraction since 1929. The mechanism is structural: when credit collapses, investors and central banks rush to the one asset with no counterparty risk. Gold is not correlated with real estate debt cycles — it moves inversely to them. This is the foundation of why investors buy gold as a cycle-aware wealth preservation tool.
7
Should I sell my real estate before the next cycle peak?
This depends entirely on your personal financial situation, leverage level, and investment horizon — and should be decided with a qualified financial advisor. The cycle framework suggests that investors with heavily leveraged real estate positions face meaningfully elevated risk heading into a contraction. Reducing leverage, selling non-core speculative property, and reinvesting proceeds into capital preservation assets (physical gold, senior miners, cash) is the historically supported late-cycle move. Owner-occupied primary residences are a different consideration than investment properties.
Past performance does not guarantee future results. Historical cycle patterns are
educational frameworks, not predictive guarantees. This article does not constitute
personalized financial advice. Always consult a qualified financial advisor before
making investment decisions.